|
NOTE: This is a no longer supported legacy program and
its function has been taken over by SVIEW_L. Even
though that program is part of the AABS package, it is also
recommended for standalone operation. The notes below are
intended to serve as additional documentation, but the
executables now have legacy status.
This program was
originally designed to preview/modify/output broadband rotational
spectra recorded with BWO based MMW spectrometers. It can,
however, be applied to any type of spectrum and it contains some
features not found in commercial spectral transformation
programs. The principal options are:
- input from the compact IFPAN MMW binary
storage mode
- input from two column ASCII, in which case
the first line in the file is assumed to contain a descriptive
comment, and the remaining lines should contain
[frequency,intensity] pairs. The two values in each line should
be separated by at least a space or a comma, and it is best if
frequency increments are equal. If they are not then the
program will interpolate its own equally spaced set of points
by cubic splines
- flexible scrolling/zooming along the
frequency and the intensity coordinates
- measurement of peak frequency, intensity and
linewidth
- background subtraction using least squares
smoothing
- output for the gle program which, in turn, can
produce publication quality PostScript diagrams
- output of processed spectrum into the IFPAN
MMW binary file
- easy reconfiguration to adapt to the
preferred size/style of the graphics window
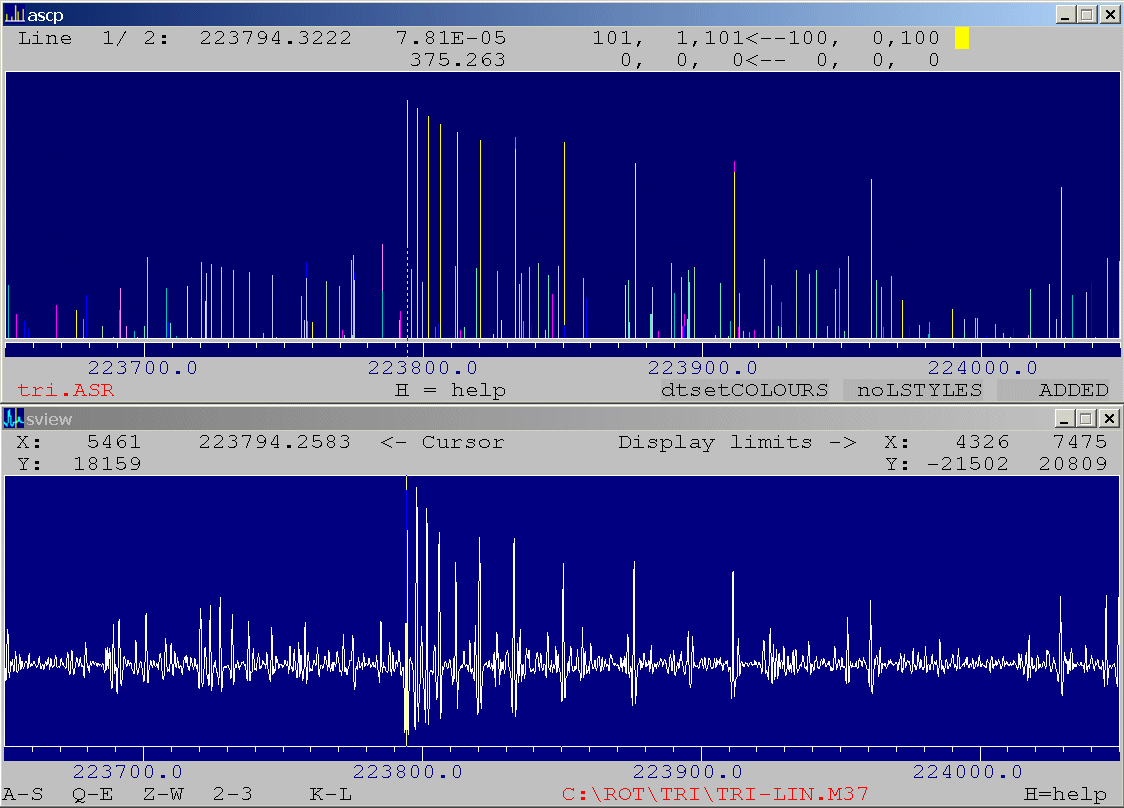
- the program has a half-height option so
that SVIEW and
ASCP can be used
to display predictions and spectra in the form of synchronised
strips for easier assignment work - see this
example
|
 |
| |
| |
Current version |
| SVIEW.FOR |
The listing - this is intended for
CVF6 compilation. The
compilation options for Visual Studio are:
FORTRAN:
/check:all /compile_only
/fpscomp:filesfromcmd /libs:qwins
/nologo /nopdbfile
/optimize:3 /traceback
/tune:pn1 /architecture:pn1
/static
LINK:
kernel32.lib /nologo
/subsystem:windows /pdb:none
/machine:IX86
/out:"Debug/SVIEW.exe"
|
| SVIEW.EXE |
Standard executable for Win95/Pentium I
upwards and for 100000 spectral points. Key properties of
the display window, namely size and font may now be read
from the file SVIEW.CFG (below). The colour depth of the display should be at
least 8 bits (256 colours).
In Win95 and 98 it is most convenient
to launch SVIEW from the
command prompt (i.e. the window that pretends to be the
old MS-DOS) preset to the directory containing the
spectra.
In WinNT/2000 (and sometimes in
W95/W98) it is better to use drag and drop operation of
spectral file onto the program icon. For a lot of work on
files in one catalogue it is also useful to navigate
there with FileSelect, as NT/2000 (but not W95+),
defaults to that directory on further reruns of
SVIEW.
If the .CFG file has been tweaked to
some nonstandard conditions, and a command prompt launch
is preferred, then it is generally safer to launch from
'MS-DOS' in a window, rather than in full-screen
mode.
|
|
SVIEWF.EXE
SVIEW6.EXE
SVIEW10.EXE
|
Executables for longer spectra - the F version is for 3M
points, 6 and 10 are for 6M and 10M points respectively.
The need for longer versions has arisen from the use
of SVIEW to view the FASSST
spectra from Ohio State. Several ways for converting
those spectra from their native IgorPro version into the
SVIEW format have been developed by Ivan
Medvedev. Here is an additional one, which is
external to IgorPro. This is a stand-alone program:
CIS.FOR (source) and CIS.EXE (executable), working on a
saved IgorPro wave.
|
| SVIEW.CFG |
Configuration file for SVIEW, which has to
reside in the directory C:\ROT.
This allows setting of
window size, of font type and of its style. The text is
hard coded for 30x80 characters, so pixel sizes for the
window have to be suitable multiples of this. If
SVIEW.CFG is
not provided then the program will default to a 800x540
pixel window. If settings in SVIEW.CFG
cannot be set then the
program will display 'Graphic1' instead of the usual header and character size
will be noted to be incompatible with window
size.
Only the first set of
parameter declarations in SVIEW.CFG is used, the remaining sets are
examples of other working declarations, and can be
substituted /experimented on as required.
SVIEW.EXE can be placed
and executed from any directory but the
recommended installation procedure is:
- Copy
SVIEW.EXE and SVIEW.CFG to directory C:\ROT
- Place shortcut
to SVIEW on the desktop
- If command line
operation is desired then add C:\ROT
to the path
|
| SVIEW_KEYS.PDF |
Summary of command keys for SVIEW. The pairs of cursor
keys for scaling and scrolling operations have been
selected on the basis of position on the QWERTY keyboard.
The intended ergonomy of use is perturbed on some other
(e.g. German, French) keyboards, in which case a possible
remedy is to switch to the EN keyboard while using this
program.
A byproduct of rapid use of these control keys is that
the user can inadvertently press the Ctrl S key combination,
which stops the program and it no longer responds. If
this happens press Ctrl
Q.
|
| |
Examples |
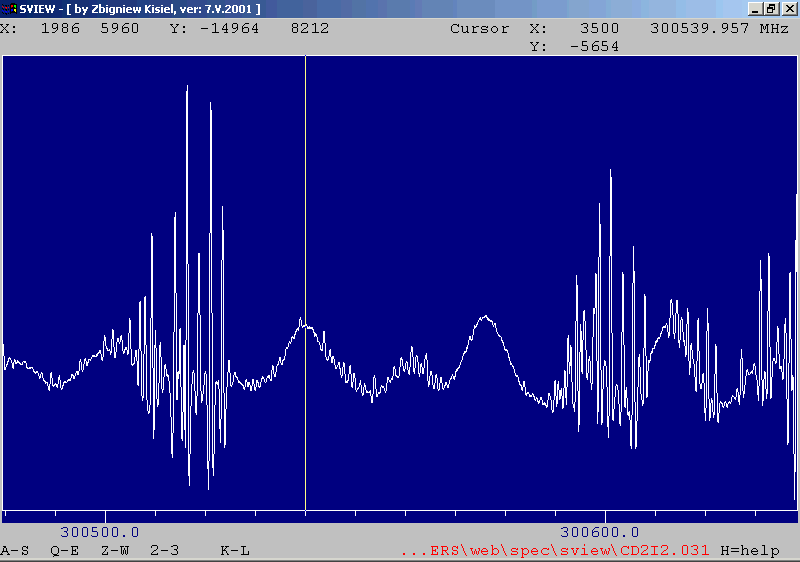
| CD2I2.031 |
Sample spectrum to play with (in IFPAN
binary format)
snapshot1.gif - snapshot
of SVIEW display
of part of this spectrum
snapshot2.gif - snapshot of
the same segment with baseline subtracted out using the
smoothing algorithm
|
| |
Legacy
versions |
| SV_M5.FOR |
The last
version with MSF5
graphics - there turned out to be too many
limitations and this version is no longer supported.
Remember that ANSI.SYS is required for the intended appearance of the front
screen. |
| SV_PS1.FOR |
The last
version with MSPS1
graphics. No longer supported for the same
reasons as above. Remember about ANSI.SYS and also that the
use of optimization on compilation destroys the
graphics. |
|
|
 |
Back to the
table of programs
| MODSPE |
MODification
of SPEctra
|
|
NOTE: This is a no longer supported
legacy program but its most useful
features have now been transferred to SVIEW_L.
This program is
capable of miscellaneous operations on stored spectra. It
supports all file formats, which have been used at IFPAN -
without the frequency scale, with nonlinear frequency scale, and
with linear frequency scale. Only the linear frequency scale
spectra are currently used and the most useful options not
available in SVIEW :
- merging of spectra
- chopping of spectra
- reversal and various rescaling options for X
and Y axes
- modification of header
information
- output of spectra as two column
ASCII
- conversion of spectrum to sticks for display
with ASCP
- printout of long spectra on a single strip
of paper (but only on old mosaic printers)
|
|
| |
| MODSPE.FOR
MODSPE1.FOR |
The listing - the program is for
compilation with MSF5
and, owing to limitations of that
compiler, has to be compiled as two modules, combined at
the linking stage.
ANSI.SYS
is required for the
intended appearance of the text screens - this is a set
of commands to generate fancy looking text in the old
MS-DOS, and they are still available for the MS-DOS
window in current Windows. To activate this feature place
the line DEVICE=%path%\ANSI.SYS
in your
CONFIG.SYS or the CONFIG.NT
file,
where %path% is the appropriate path. Be aware
that the ANSI.SYS commands were one of the earliest
features of the early DOS exploited by some viruses to do
their dirty work - this is now hopefully only of
historical interest.
|
| MODSPE.EXE |
Executable compiled with MSF5, launched from the
MS-DOS command prompt. Use the CD2I2.031
spectrum as an example.
This is a 16-bit executable and these days it cannot be
launched directly in Windows, but it is possible to use a
suitable emulator, such as DOSBOX.
|
|
|
|
Back to the
table of programs
| LISTSPE |
LISTing of
SPEtra in
IFPAN binary format
|
This program
produces a listing of spectral files saved in the binary standard
used at IFPAN and read by SVIEW_L. The file
entries are sorted according to frequency
and the resulting list is saved to
file LIST.
LISTSPE should be launched from
the command window opened on the directory of
interest, since the program will only inspect the contents
of the current directory.
The program
is used when the frequency region of interest is covered by
multiple spectra and is analysed by means of the AABS package.
If the LIST
file can be placed in the project directory, then it will be read
by the ASCP_L program. The
frequency coverage of the various spectra will be displayed on
the frequency scale and file names will appear at top-left of the
program window.
|
|
| |
| LISTSPE.FOR |
The listing.
The program is limited to the NTFS file
system..
|
| LISTSPE.EXE |
The executable. |
| LIST |
Specimen output file
produced by LISTSPE
|
|
Other
versions |
LISTWG.FOR
LISTWG.EXE
|
Lister for spectra recorded with the
waveguide FTMW spectrometer, saved in the binary standard
of the Kiel laboratory. These files are read by the
VKIEL program, which
can generate a synthetic spectrum of all files found in a
given subdirectory. The availability of such a file
to ASCP_L
allows easy navigation between segments in such a
spectrum.
|
LISTCP.FOR
LISTCP.EXE
|
Lister for chirped pulse spectra saved in
the binary .FID standard of the IFPAN laboratory.
|
|
|
|
Legacy
versions |
SLIST_OLD.FOR
SLIST_OLD.EXE
|
Legacy version, which required preliminary manual
generation of a directory listing using:
dir
specnam.*>A for
DOS/Win95+
dir
specnam.*/-N>A for
NT/W2000 The directory listing
file A
was then declared as input file for
SLIST, which
inspected all spectral files in turn and write a
frequency sorted listing of their contents to file
LIST.
The earliest versions of
this program required
ANSI.SYS.
|
|
|
|
Back to the
table of programs
| FM |
File
Manager for FTMW spectral
files
|
|
This program manages
archives of spectral files recorded on the IFPAN FTMW
spectrometer. Archives are in a simplified format consisting of
binary coded spectra stuck end to end. The principal options
are:
- creation of a new archive and placement of
all spectral files in the current directory in this
archive
- addition of spectral files in the current
directory to one of the archives already in existence in this
directory
- extraction of all spectral files from a
selected archive to the current directory
- listing of files in a selected archive, this
option also stamps old archives with frequency limits of
spectra in the archive
- compatibility with both single and double
frequency down-conversion IFPAN files
|
|
| |
| FM.FOR |
The listing -
this only has text screen operations and is intended to be
launched from the MS-DOS window (i.e. the command prompt)
first set to the directory containing the files of
interest |
| FM.EXE |
Windows executable. |
|
|
|
Back to the table of
programs
| V6_20 |
Viewer
for FTMW Spectra
|
|
This program manages
archives of spectral files recorded on the IFPAN FTMW
spectrometer. Archives are in a simplified format consisting of
binary coded spectra stuck end to end. The principal options
are:
- creation of a new archive and placement of
all spectral files in the current directory in this
archive
- addition of spectral files in the current
directory to one of the archives already in existence in this
directory
- extraction of all spectral files from a
selected archive to the current directory
- listing of files in a selected archive, this
option also stamps old archives with frequency limits of
spectra in the archive
- compatibility with both single and double
frequency down-conversion IFPAN files
This
program views FIDs from supersonic expansion, cavity FTMW
spectroscopy and carries out FFT to the frequency domain.
The FIDs can be either from a collection of individual files or
can be extracted from archives created with FM. The principal
options are:
- selection from among the available archives
or display of all unarchived spectra found in the current
directory
- initial summary screen of interferogram
intensities as a function of frequency
- scrollable main summary screen of the
appearance of nine neighbouring interferograms at a
time
- display of each individual interferogram/its
FFT with options for tailoring the FFT conditions, scrolling,
peak measurement and ASCII dumps of data for plots with
gle
- generation of
synthetic frequency domain spectra from all interferograms read
into the program
- compatibility with
both single and double frequency down-conversion IFPAN
files
The name of this program is not exactly transparent but
results from evolution from the first 1998 version, which took
place in the following stages:
VIEWM (DOS version) ->
V32 (32 bit system version)
-> V6 (Windows graphics with
CVF6
Fortran) -> V6_20 (update to
deal with single step frequency downconversion to 20MHz)
|
|
| |
| |
Current version |
| V6_20.HDR |
The header part
of the listing allowing a quick check of the date of the
current version and modifications. Subversions of the
program are identified by the date printed on the launch
screen. |
| V6_20.EXE |
The Windows executable, which can deal
with:
- up to 550 spectral files
- up to 25000 points in each
interferogram
IMPORTANT: The program uses a specific scheme of reading all files in the current directory, termed 8.3 filenames. In more recent versions of Windows (such as W10) support of this scheme, though available, may not be switched on by default. In order to do this you need to open the Command Prompt window as an Administrator and type:
fsutil behavior set disable8dot3 0
This sets an appropriate registry value, but even then input of files with long names generated prior to 8.3 support will not take place. But if all such files are copied to some temporary directory, the originals deleted, and the files copied back, then 8.3 access will be possible.
|
| V6.CFG |
Configuration file
defining the graphics window to be used by V6_20.
This file has to be placed in the mandatory directory
c:\FFT,
and it is also recommended that V6_20.EXE
is also placed there.
|
|
|
| |
Legacy versions |
| V6.FOR |
Listing of
the version for double frequency down-conversion (to zero
frequency with folded upper and lower sidebands), which has
been extensively rewritten for compilation with
CVF6
|
| V6.EXE |
The executable from compilation with
CVF6.5, for 800x600 pixel graphics and
- up to 500 spectral files
- up to 850 points in each
interferogram
|
|
|
| V32.FOR |
The listing of
the last version prior to CVF6. |
| V32.EXE |
Standard version of the above
(MSPS1, VGA graphics),
limits:
- 500 spectral files
- 850 points in each
interferogram
|
| V324.EXE |
MSPS4 version, dimensioning
as for V32 |
|
|
| VIEWM.FOR |
First part of listing for MSF5
compilation |
| VIEWM1.FOR |
Second part of listing for MSF5
compilation, compile separately, then link. |
| VIEWM.EXE |
Small version for operation in low DOS
memory (MSF5, VGA graphics) with
decreased limits of
- 70 spectral files
- 400 points in each
interferogram
|
|
|
| VIEWF.FOR |
Viewer of all spectral files in the
current directory. Microsoft graphics
and is set for simplest compilation: MSF5 and execution in
lower memory. |
| VIEWF.EXE |
MSF5 executable for VGA
graphics only. |
|
|
|
Back to the
table of programs
| FFTS |
General FFT
program for Spectral data
|
|
This is a general FFT
program primarily designed to deal with various types of Free
Induction Decay (FID) records obtained with FTMW
spectroscopy.
It is
possible to use straightforward input from (time,intensity) ASCII
pairs, but the program also contains many optimisations designed
for IFPAN multi-microwave pulse per one gas pulse schemes of
chirped-pulse and Balle-Flygare cavity
spectroscopy. NEW (Jan2020): input of .DAT files from the FTMW++ program of J-U. Grabow is supported.
The key features
of the program have been described in the paper: Z.Kisiel,
J.Kosarzewski, Acta
Physica Polonica A, 131,
311-317 (2017), which is
recommended for citing the use of FFTS. Some features
that have proven most useful in general
use:
- choice of windowing functions and of zero filling
length,
- ability to see lines outside the nominal excitation
regions, such as below 8 GHz for 8-18GHz chirped pulse FIDs, or
above 8 GHz for 2-8 GHz chirped pulse FIDs (see Fig.6 of the
reference paper),
- multiple operations on multipulse FID records,
including snippet FFT diagnostics (see Fig.4 of
paper),
- time domain removal of
spurious/unwanted lines,
- output to format of
the SVIEW_L viewer of
the AABS
package.
FFTS reads several types of
files:
- Binary .FID files converted from
the multipulse traces averaged with the LeCroy 735 oscilloscope
and initially saved as its own binary .TRC files.
Those are first converted to .FID files by using
the program WF735 (automatic during measurement on the IFPAN cavity FTMW spectrometer). Each
.FID file is
compatible with the binary .SPE standard of SVIEW_L, but is
accompanied by a .TRC.INF file
containing in ASCII information derived from the oscilloscope
waveform header and the pulsing parameters. The
.FID
files preserve the multi-microwave pulsing information per one
gas pulse, which can be diagnosed and coadded in different
ways.
- Binary .FFT files in the .FFT standard where
the microwave multi-pulsing per single gas pulse has been
coadded. The FIDs can be:
- chirped pulse excitation files (multi Mpt
files supported)
- cavity FTMW files from single frequency
conversion (typically to 20 MHz)
- cavity FTMW files from legacy double frequency
conversion to zero IF (in this case the display is treated as
+ve sideband only)
- Two column ASCII files with
(time,intensity) points, where time has to be given in
microseconds and has to be in uniform increments. This is
the most general input option, but once in the FFT screen it is
recommended that the data is saved as a binary .FFT file since this
is a compact representation with 4-bytes used per point
intensity, and little additional
overhead.
- Binary .DAT files
containing FIDs recorded with the FTMW++ program of Jens Uwe
Grabow. The files can be processed within FFTS, and can also be
converted to .FFT format for use by V6_20. That program supports batch file input and spectrum synthesis.
Drag and drop file
input is supported. FFTS is also usually declared
as the default program to open files of the
type .FID
and .FFT.
Once the data has been read FFTS operation
is through several different screens. The first (usually
manually or automatically skipped) screen is the coaddition
screen, which gives access to several diagnostic screens and to
the most commonly used FFT screen. Each screen is operated
with keyboard key selected options, and either displays a list of
active keys or gives access to a dedicated help screen.
The options for the most commonly used FFT
screen:
|
| A,S |
horizontal shift (lower case = slow,
upper case = fast) |
| Q,E |
horizontal zoom |
| W,Z |
vertical scaling
|
| F |
go to a specified frequency (+ve
value) or set the display width (-ve value) |
| N |
change zero filling
(n = 0,1,2,3..) |
| ctrl N |
change the windowing
function |
| ctrl O |
remove the nearest peak in the
frequency domain by fitting a constant intensity sine wave in the
time domain
|
| ctrl P |
remove the nearest peak by fitting an
exponentially decaying sine wave |
| T |
toggle the display Y-axis between
power/amplitude/modified amplitude
|
| H |
show the help screen |
| U |
binary/ASCII output of the current FFT
|
| ENTER |
output of the coadded FID to a binary .FFT standard
file |
|
|
| I |
Go to the FID inspection
screen. The main task in this screen is to refine the
selection of the region to be used for the FFT by setting suitable
markers with the A,S and K,L keys. Several FID
transformation/filtering/inspection options are also available
there.
|
Running FFTS
under Linux
|
|
The program has been tested under Ubuntu/Wine in the configuration
as described for the
AABS
package. The installation of FFTS
is simpler than of AABS, and it
is only necessary to:
- copy the v6.cfg file to a user
created directory ~/.wine/fft
- copy the ffts.exe file to a
suitable directory such as ~/Documents/rot or
~/Documents/fft ,
depending on the preferred location of the molecule project
directories
|
|
| |
| FFTS.HDR |
The header part
of the listing allowing a quick check of the date of the
current version and modifications. Subversions of the
program are identified by the date printed on the launch
screen.
|
| FFTS.EXE |
Windows executable. |
| V6.CFG |
Configuration file defining the graphics
window to be used by FFTS.
This file has to be placed in the mandatory directory
c:\FFT,
and it is also recommended that FFTS.EXE
is also placed there.
The settings in this file are explained in its header text,
but you might also find the description of the related
AABS.CFG file to be
of some use.
|
|
|
|
Back to the
table of programs
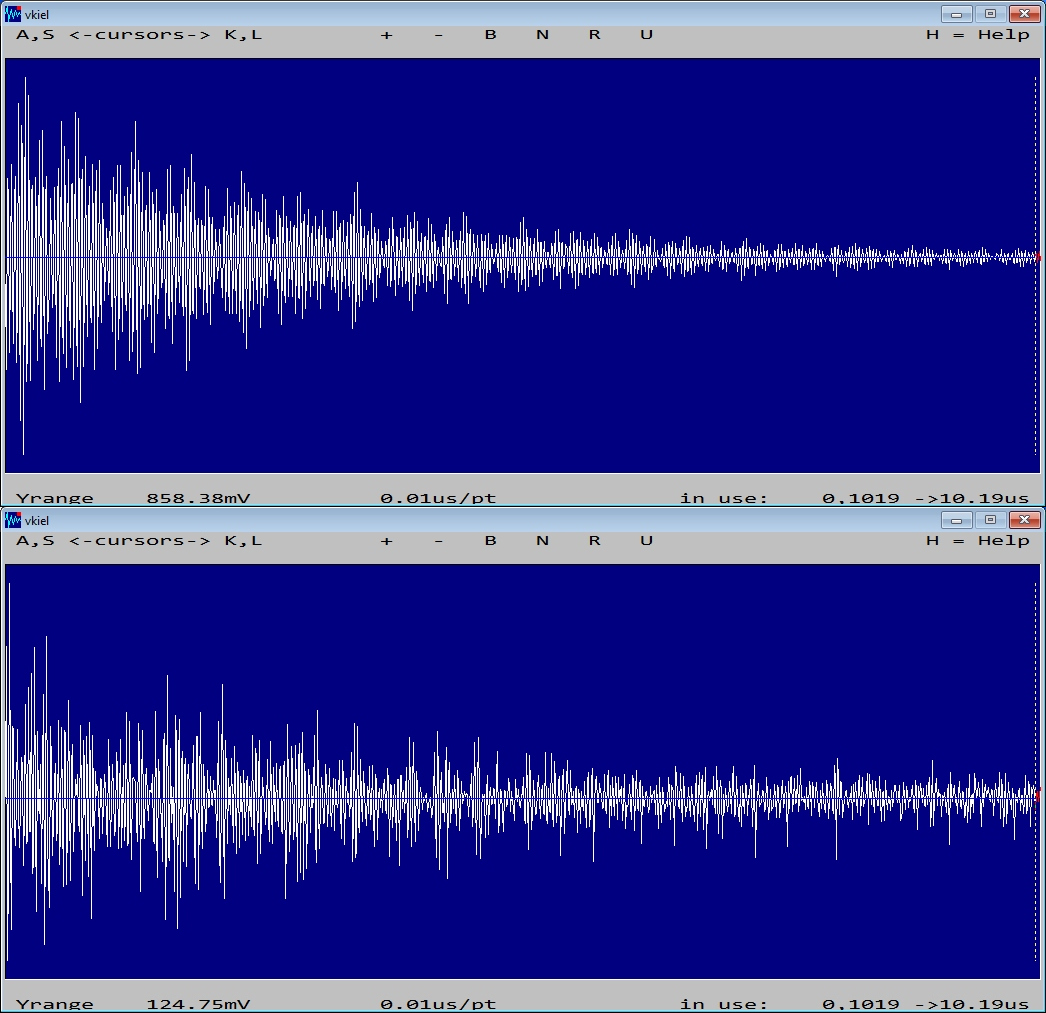
| VKIEL |
Viewer
for KIEL FTMW spectral files in the
current directory
|
|
This program views
FTMW files in the current directory that have been recorded in
one of the two standards encountered in Kiel:
- MWFTSBI 1.0
of the X/P band waveguide
spectrometer
- FTMW2.x
of the K-band waveguide spectrometer
The
program reads all interferograms in the selected directory,
provides an overview of their coverage, and allows easy access to
each interferogram. The available processing options
are:
- FFT with zero-filling up to 64k points using
the spctrm
routine, which gives better resolution and less
distortion in the frequency spectrum than realft - see comparison1 and comparison2
- Amplitude and power spectra
- Easy scrollability and measurement of the
frequency-domain spectrum
- Optimisation of the FFT by several filtering
options in the time-domain, and user selection of points
subjected to the FFT - see the effects on the right hand side
of comparison1
- gle output for PostScript
diagrams
- Flexible combination of interferograms into
a single synthetic spectrum with user configurable options. The
spectrum can then be inspected/processed further with
program SVIEW_L of the
AABS
package. It can be confronted with predictions and
standard mechanisms for measuring lines and creating the
fitting data files can be used. The
interferograms can be the result of a scan, such as that made
with MWFTSBI
but this is not mandatory.
|
|
| |
| VKIEL.HDR |
The header part
of the listing allowing a quick check of the date of the
current version and modifications. Subversions of the
program are identified by the date printed on the launch
screen. |
VKIEL.EXE
|
The Win32 executable. In Windows10
the program window may exhibit additional decoration on
the borders (such as minimum scroll bars). In that
case specify the program to be run with WinXP
compatibility using:
Right click on the executable -> Properties ->
Compatibility tab -> tick the box "Run this program in
compatibility mode for:" -> select "Windows XP
(Service Pack3)" -> Apply
VKIEL is compiled to read up
to 1000 FTMW files, each up to 4096 points long.
For program startup, do any one of:
- Call the program from the command line set to the
directory containing the data, assuming the PATH leads to
the directory containing VKIEL.EXE
- Launch the program from an icon on the desktop
- Launch the program from any file manager
Only method 1/ assures that the program will operate
directly on the directory of choice. In methods 2/ and 3/
the starting directory depends on the operating system
and previous usage. It might be necessary to navigate to
the directory with spectra using the SelectFile window
obtained by pressing the ESC key while in the title
screen.
|
| VKIEL.CFG |
Optional configuration file for VKIEL,
which has to reside in the
directory C:\FFT. If
this file is not used then the program defaults to window
size of 800x540 pixels.
The use of VKIEL.CFG and istallation of VKIEL are
analogous to those described for SVIEW.CFG, with the
difference that the directory is to be C:\FFT instead of C:\ROT.
|
|
Accessory
program
|
| LISTWG.FOR |
Listing program for VKIEL compatible files
present in the current directory. This program
produces the file LIST for use by
program ASCP_L of the AABS
package by identifying the available spectra on the
frequency axis and by displaying the relevant file
names.
|
| LISTWG.EXE |
Windows executable.
|
|
|
|
Back to the
table of programs
| FIDFIT |
FID FITting
in the time domain
|
|
This is a modified
version of the program DECAYSBN2B with
operation as described in:
- J.Haekel and H.Mader,
"Determination of Spectral Parameters in Microwave Spectroscopy
by Analysis of Time-Domain Signals",
Z.Naturforsch. 43a, 203-206 (1988)
DECAYSBN was
written by Jurgen Haekel, a PhD student of Heinrich Mader at the
Institut fur Physikalische Chemie of the University of Kiel,
Germany.
The program
allows line by line fitting of Microwave Fourier Transform
data directly in the time-domain. There are many uses, such
as removal of strong lines from the spectrum or the
determination of the relaxation parameter T2 with statistics.
FIDFIT keeps the internal workings
of DECAYSBN
unchanged, while bringing it into the XXIst century. Binary
spectral files are in the standard read by the VKIEL program, which can be used
to inspect/modify the results of FIDFIT.
|
|
| |
| FIDFIT.FOR |
The source
code. The program is a work in progress, in
proportion to the understanding reached concerning its
operation.
|
| FIDFIT.EXE |
The Win32 executable. This is a
straightforward console program, so it can also be compiled
and run under Linux.
The most convenient mode of operation is to use a control
("Steuerung") file, which contains the responses to
questions posed by the program for a given mode of
operation.
|
|
Worked
example |
fbenz165.cfg
|
Annotated control file for fitting (and
removal) of the three dominant lines in spectrum
fbenz.165
Note that for alphanumeric string input the annotations
need to be placed after the first 20 columns. For
numerical input these have to be after the last expected
number.
|
| fbenz165.001 |
Program output. A single
configuration file allows multiple runs and the extension
(.001 in this case) is assigned by the program.
|
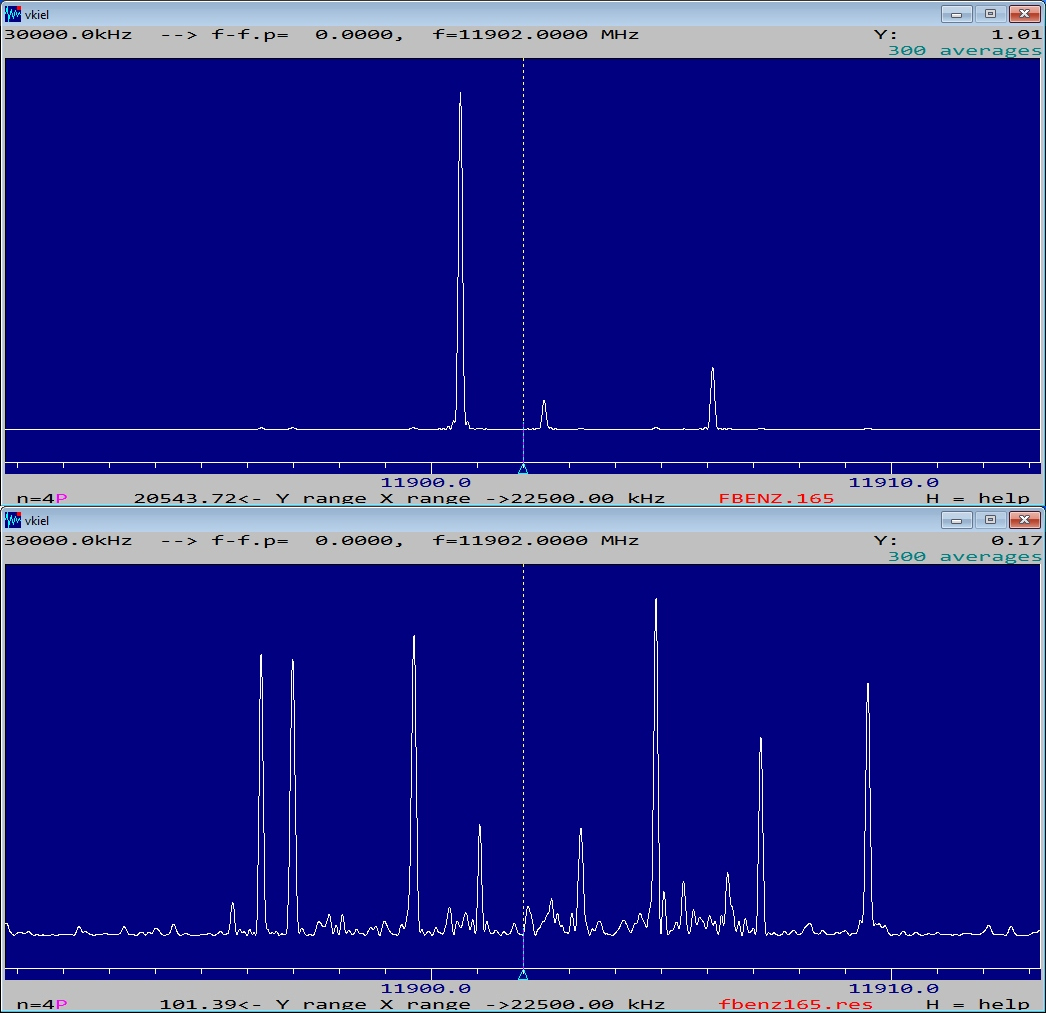
| fbenz.165 |
Source spectrum (binary file) |
| fbenz165.res |
Residual spectrum (binary file) and
comparisons of before and after frequency and time-domain plots
|
|
Legacy
code
|
DECAYSBN.FOR
IO4.FOR
SUB5.FOR
S1N.FOR
|
The original, unmodified code of the
program dated 1992.
For practical reasons the code was split into four
segments, but these can be concatenated and compile with
only minor tweaks. Actual operation on current data
requires changes to input/output file handling.
|
FILSTRUC.TXT
|
Binary file structure used by
DECAYSBN
|
|
|
|
Back to the
table of programs
|