Gain loss asymmetry for emerging stock markets
Stock indices for European emerging markets are analyzed using investment horizon approach. Gain-loss asymmetry, originally found for
American DJIA index, is observed for all analyzed data.
It is shown, that this asymmetry has different character for emerging and for established markets.Austrian ATX index and Dow Jones have been studied and compared with several emerging European markets. When optimal investment horizon is plotted as a function of absolute return value, for established markets gain curve lies typically above loss curve, whereas in the case of emerging markets the situation is opposite.In the latter case one has to wait longer for loss than for gain of the same return value. We propose a measure quantifying the gain-loss asymmetry that clearly exhibits a difference between emerging and established markets.
Time horizon measurments
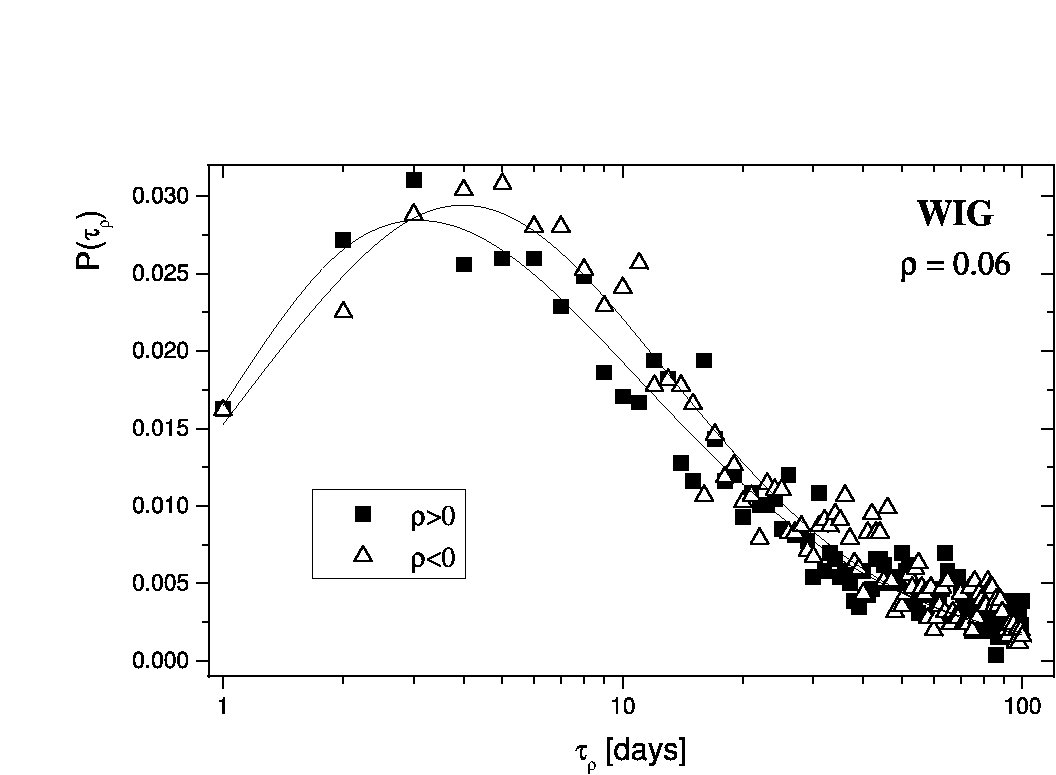
WIG investment horizon distribution calculated for return values $\rho=0.06$ - closed squares and $\rho=-0.06$ - open triangles.
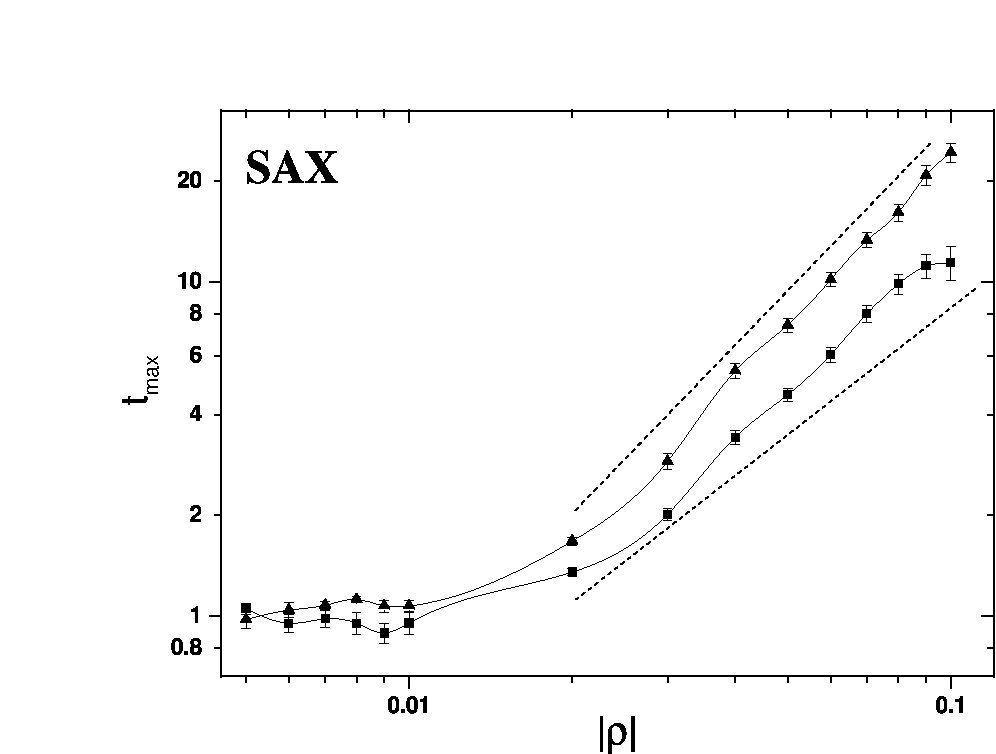
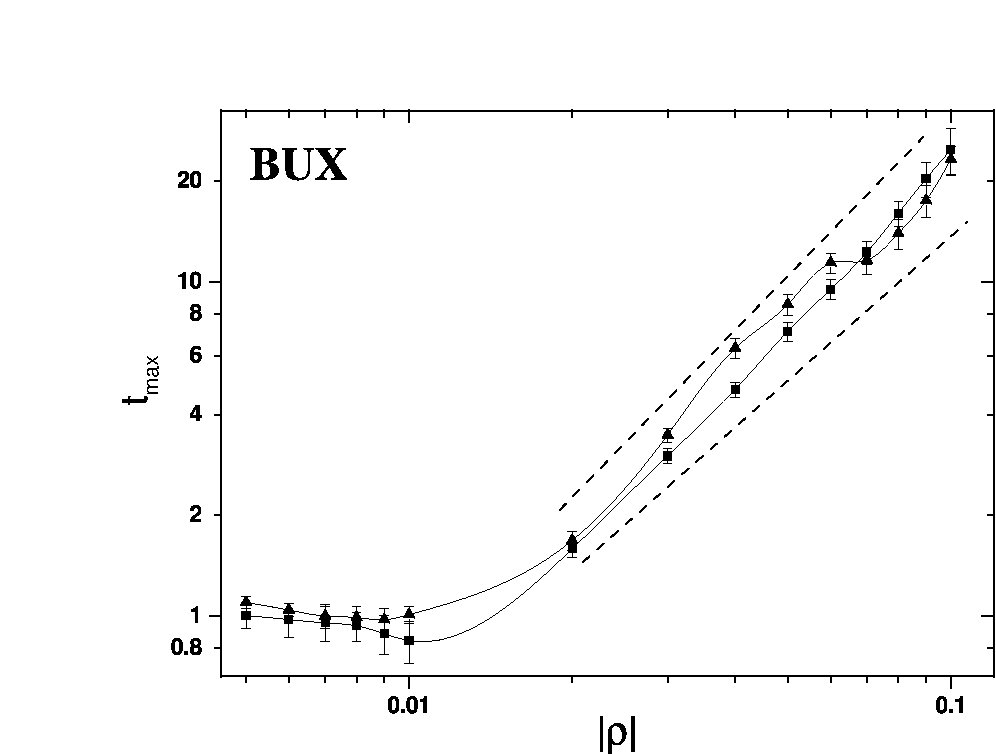
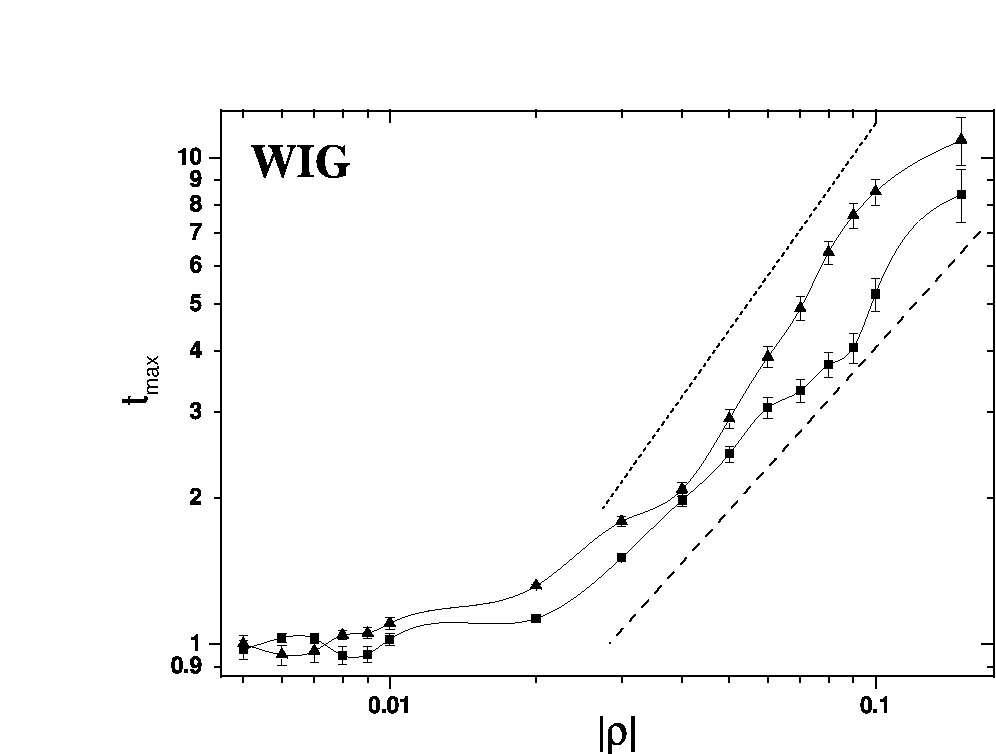
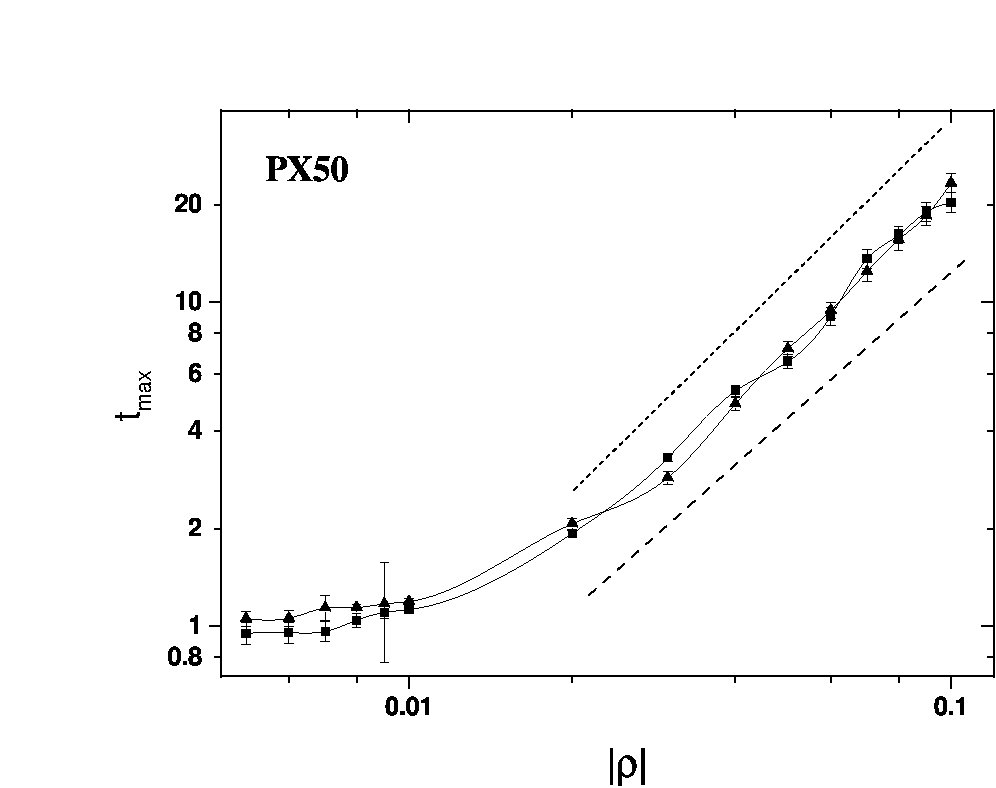
Optimal investment horizon plotted as a function of absolute return value for a)SAX, b)BUX, c) WIG and d)PX50. Data for $\rho>0$ are marked by squares, and for $\rho<0$ by triangles.
Dashed lines show average slope of gain and loss curves.
Publications:
Comparison of gain-loss asymmetry behavior for stocks and indexes.Gain-loss asymmetry for emerging stock markets.
Presentations:
Asymmetry.
go back
© 2008 Agnieszka Cygan